Nothing lasts forever – even the insights from your last survey go stale after a while. One way to keep your survey results fresh and actionable is by running your survey again and creating a multi wave tracking study, also known as tracker or tracking survey. A tracking survey is a survey that asks the same questions across an interval of time, which allows you to “track” the changes from one deployment to the next and find trends over a certain period. Each time you send your survey, whether it’s annually, quarterly, or more frequently is called a “wave.” Comparing survey results across waves will show trends and changing attitudes that can either prove your decisions are solid or indicate it’s time to change course.
The need for trackers: attitudes and preferences change
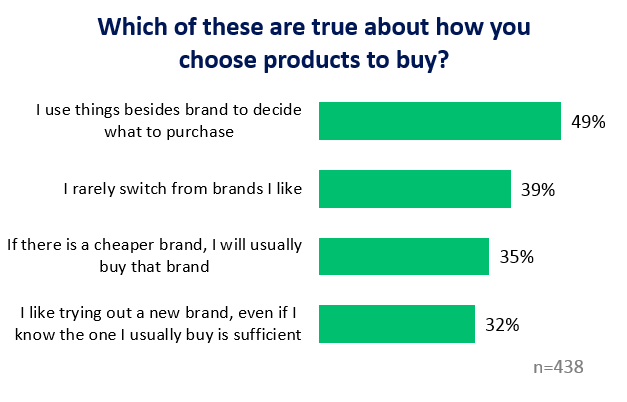
Consumer preferences are always shifting. Take brand loyalty as an example. A recent study on SurveyMonkey Audience showed that nearly 1 in 3 US consumers like trying out a new brand, even if they know the one they usually buy is sufficient. And about half use things besides brand to decide what to purchase.
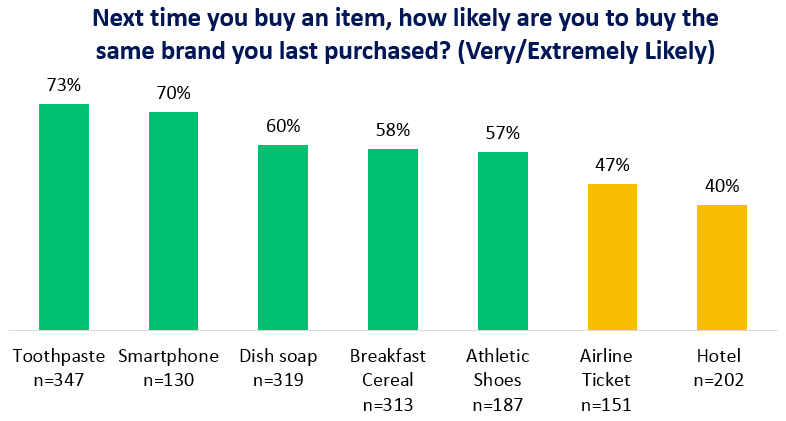
Some products have loyal customers. For example, next time consumers make a purchase, they are Very or Extremely likely to brush their teeth with the same toothpaste (73%), talk on the same smartphone (70%), eat the same breakfast cereal (58%), lace up the same athletic shoes (57%), and clean up with the same dish soap (60%).
But other products get less loyalty. You’re probably not surprised that few of us are Very or Extremely likely to use the same brand of hotel room (40%) or airline (47%) next time.
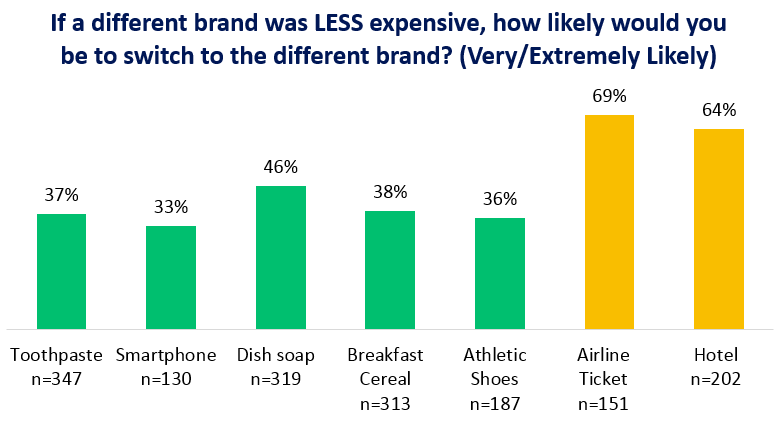
In the low-loyalty categories, consumers rely on factors besides brand to decide what to purchase. Price can be critical; 69% of airline ticket and 64% of hotel room purchasers would buy a different brand if it were less expensive.
Tracking studies get insights from a changing world
In this lack-of-loyalty-landscape, how can we understand the churning ocean of consumer preferences? One way is to check up on our customers over a period of time in a multi-wave tracking study. If the insights from one survey are like a snapshot, a multi-wave tracking study is like a moving picture that shows how attitudes and behaviors are changing and where they are headed.
Tips for running a successful tracker
Remember these key points to build and run a successful tracking study:
1. Think about your research goals and how your study fits with other information you are using to make decisions. Ultimately, you want the results to be able to influence your business decisions. Start with the decisions you need to make, what data you’d need to support that decision, and then write your survey questions from there.
2. Decide how often you’ll run your survey, create a schedule, and set reminders for yourself. This ensures you can budget for your study in advance and keeps you on track so you don’t forget to run a wave.
3. Take the time to build the first wave exactly how you need it, because you don’t want to make changes between waves. The survey writing guide in SurveyMonkey’s help center can get you off to a good start or you can take advantage of one of SurveyMonkey’s expert templates, such as brand awareness or customer satisfaction.
4. Keep things as consistent as possible wave over wave. Even slight changes to your survey design or targeting criteria can skew your data, reducing the value of your tracking study.
5. Don’t let your data sit on a shelf! Figure out what insights you can draw from the data, and you’ll continue building the value of that information with each wave. SurveyMonkey offers built-in data analysis tools, including data trends for comparing waves over time, customized graphs, team collaboration, and testing for statistical significance.
Tracking studies provide extraordinary insights into changing attitudes. Consider launching a tracking study on SurveyMonkey Audience or re-running an existing survey as a tracker – you’ll get People Powered Data that will help you make confident decisions.
About our study: On October 13, we used SurveyMonkey Audience to survey a sample of 438 adults aged 18+ in the United States. The sample was age and gender balanced according to the 2010 U.S. Census.