You pull up a chair to your desk, and open up the brand new data file you’ve just downloaded from SurveyMonkey. Ah. Nothing like the smell of new data!
You open up the file, and there you see all kinds of numbers: 56%, 40, 98%, 479... What on earth are you supposed to do with them? When are you supposed to use the raw numbers (e.g. 40 and 479)? When are you supposed to use the percentages (e.g. 56% and 98%)? Are they even measuring the same thing? As your panic level rises, the thrill of new data subsides. Instead, you just feel overwhelmed. Well, good thing you’re reading this blog post then!
The best and easiest way to start your data analysis is to look at the raw number of responses for any given question—they’re literally a count of all of the people who checked any given response. In research terminology these raw counts are known as “frequencies.” Examining your frequencies will always give you the most basic picture of your data.
Okay, so let’s try an example. You look at your frequencies, and there are 987 people who think desk calendars should be outlawed. That seems like a lot. “Down with desk calendars!” you shout.
Hold on there. Before you get on your soapbox with your chants and homemade signs against desk calendars—frequencies do not tell the whole story. Sure, 987 is a lot of people. But let’s say that you sent that survey about outlawing desk calendars to your whole office. If there are 10,000 people working in your office, then 987 votes for outlawing the calendars would only be about 9.9% of your respondents, which means that very few people in your office actually despise desk calendars.
However, if there are only 1,000 people working in your office, then 987 votes for outlawing the calendars would be nearly 99% of your respondents—almost the entire sample! So the same raw hatred of 987 for desk calendars would mean something different depending on how many people at work don’t hate the calendars. Using a percentage or a frequency as the basis for decisions about your company or non-profit or school bake sale can make a big difference. So choose wisely.
With me so far? Then let’s dive even deeper into the use of relativity in data analysis. For example, imagine you’ve created a new iPhone app. You want to know how many people have heard of your app so that you know how to structure your advertising budget. You find that 15% of respondents have heard of your app. You might think that’s bad for your app, as 15% is pretty low compared to the 100%, A+ grade level you are striving for.
Let’s say, however, that you just read a newspaper article about how the typical recognition level of a new app is about 5%. Well then, you’re actually doing pretty well! Three times as well as your average competitor in fact. Feel better?
(Pssssst: Don’t know where to look to find information about how your results compare to people who have asked the same questions as you? Use our methodologist-approved questions from Question Bank and soon you’ll be able to see how your results compare.)
The bottom line is that frequencies and percentages tell a different story. To know which to use, you need to know what your research question is up front. Here’s a handy chart to get you started:
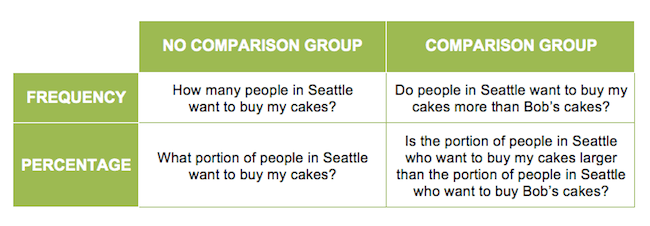
As you can see, all of the questions in the chart above are about a baker who wants to monitor their cake sales. Depending on what the question he or she is asking, however, different data should be examined. Don’t worry, you don’t have to choose what kind of question to ask your data! You can ask all four kinds of questions of your data. Just make sure you choose the appropriate analysis strategy to answer each one.
Have a research question but not sure which cell of the chart above it fits in? Post it in the comments below!